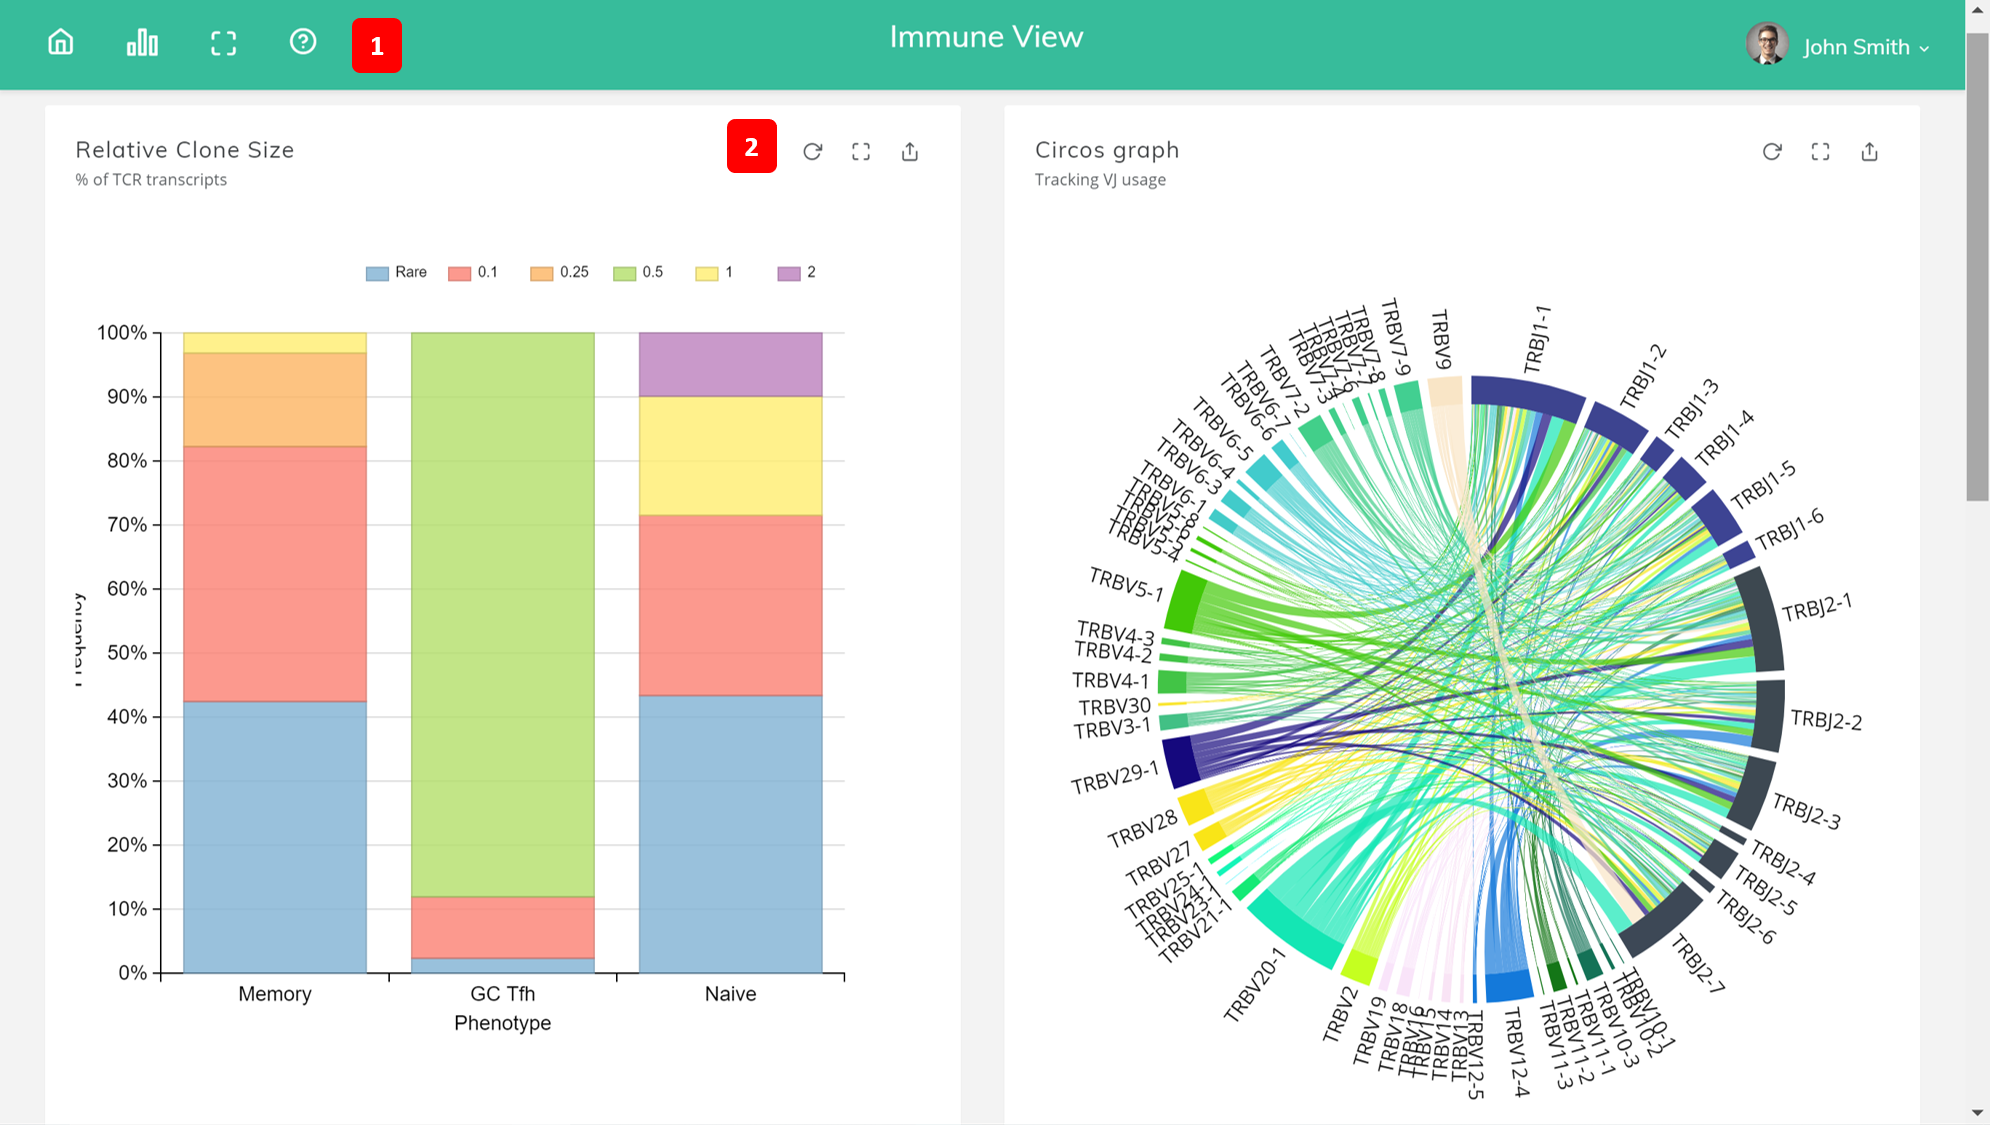
The analysis sidebar button (1), shown as a chart icon, either shows or hides the analysis sidebar (3).
There are three icons on the main content (2). The first icon refreshes the analysis, the second icon makes the analysis cover the entire screen, and the last icon allows you to share the analysis.
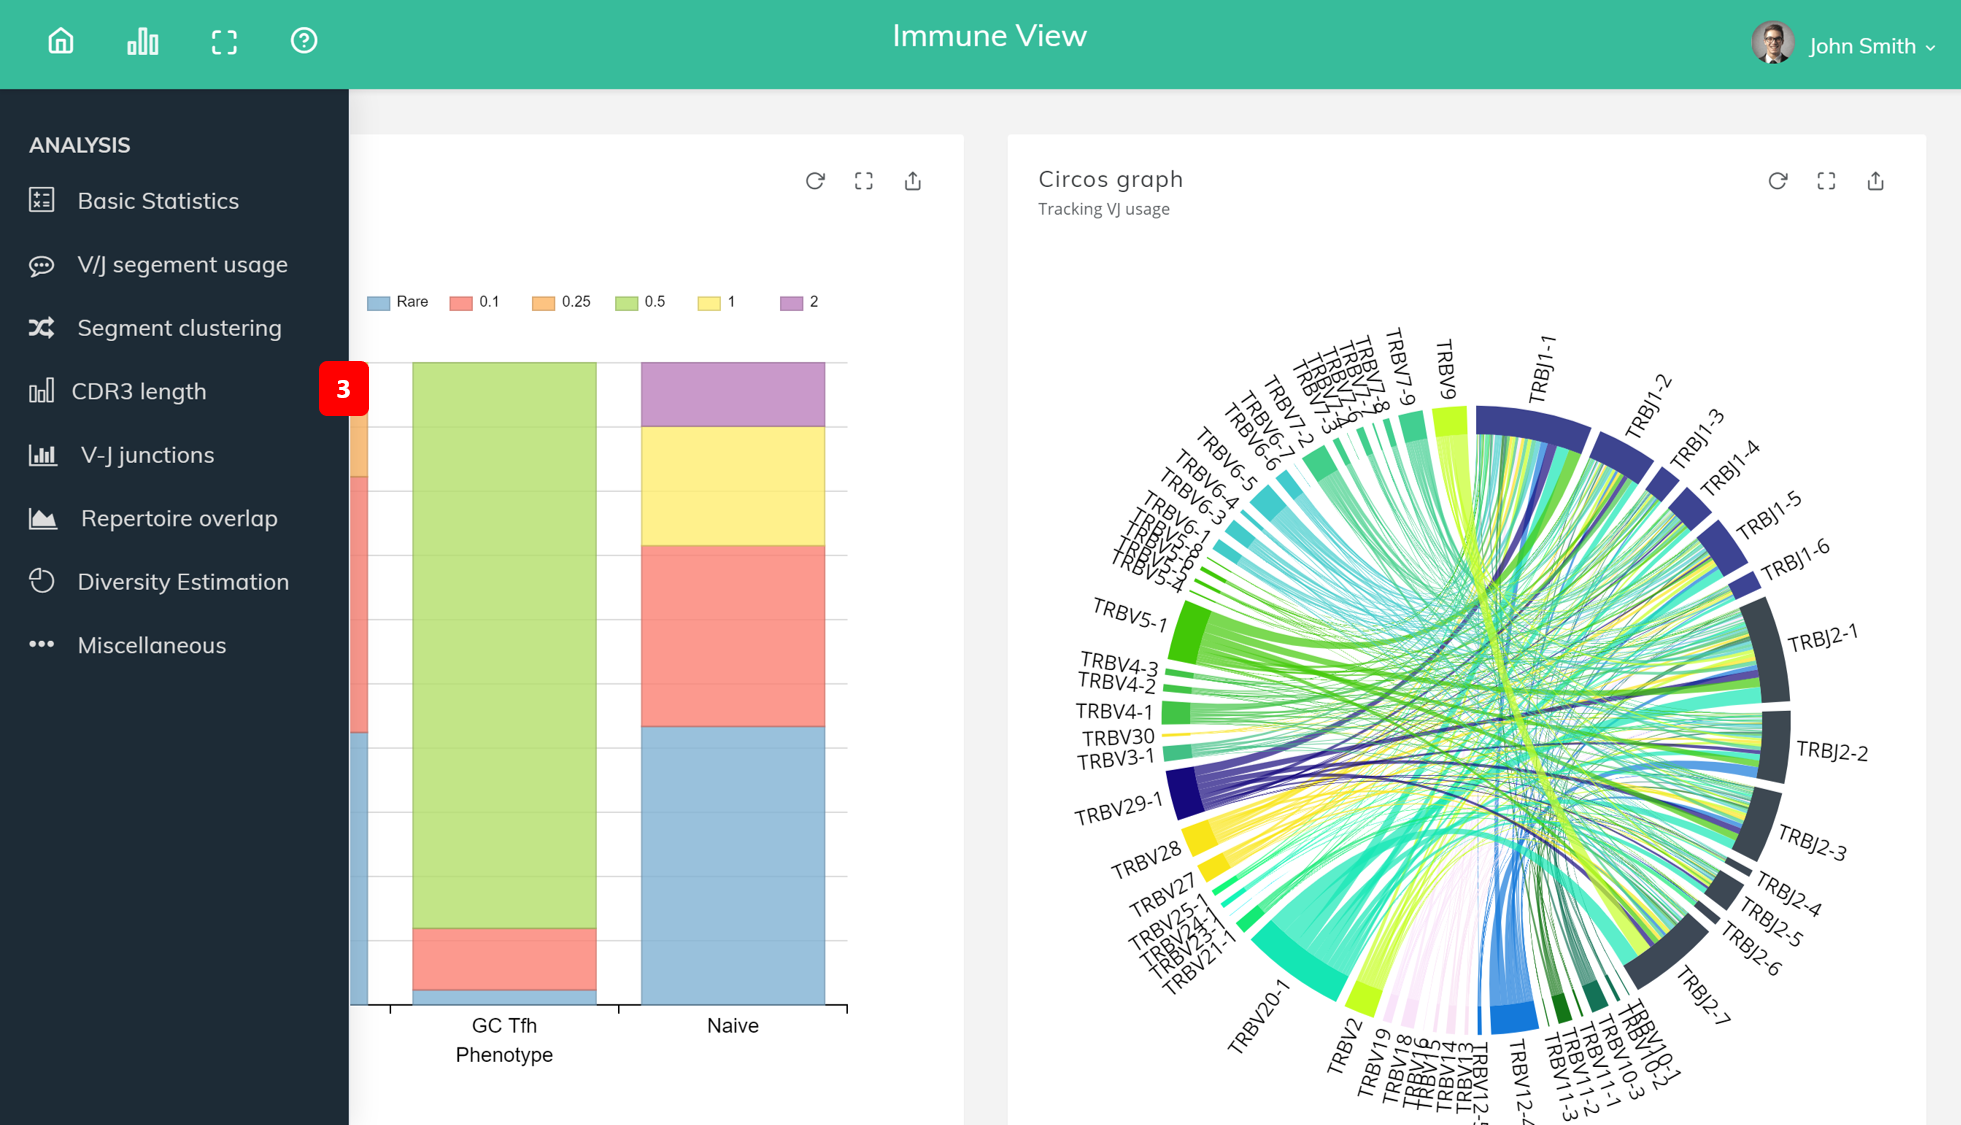
Basic statistics
This module computes a set of basic sample statistics and lists the data in table format: number of reads, number of clonotypes (diversity), mean clonotype frequency, number (and frequency) of non-coding clonotypes, mean length of CDR3, and mean number of unique CDR3 nucleotide sequences that code for the same CDR3 amino acid sequence (convergence). A select dropbox allows the user to select the sample.
V/J segement usage
This module computes the frequency of associated reads for each of V/J segments present in sample(s) and shows in bar graph.
Segment usage clustering (gene expression)
This module computes and displays segment usage heatmap and hierarchical clustering for samples and segment.
CDR3 length distibution
This module computes and plots a histogram of CDR3 lengths for top N clonotypes in a given sample. This plot allows to detect the highly-expanded clonotypes. In addition, CDR3 length distribution for clonotypes from top N V segment families is also plotted.
V-J junctions
This module computes and plots a circos-style V-J usage plot displaying the frequency of various V-J junctions.
Repertoire overlap analysis
The module allow the user to perform analysis of clonotype sharing between pair of samples or pool clonotypes from several samples.
Diversity estimation
The module cacluates and plots rarefaction curves for specified list of samples, that is, the dependencies between sample diversity and sample size.